The Ulutas Medical Journal · ISSN 2149-0430 (print), 2149-388X (online) · https://www.ulutasmedicaljournal.com/?mno=182504
Original Article · Open access
Prevalence of malnutrition among infants in Sana'a city, Yemen
Also available in: العربية · Türkçe · 中文
- Faculty of Medicine and Health Sciences, Sana’a University, Yemen ROR
- Al-Sabeen Hospital, Sana’a, Yemen
Abstract
- Background
- The Infant's undernutrition is a significant health problem in Yemen. We aimed to determine the prevalence of malnutrition among infants attending maternal and child health centers in Sana'a city.
- Methods
- A descriptive cross-sectional survey was conducted among 400 Yemeni infants aged less than 1 year attended to MCHC in Sana'a city from March to May 2012. A multi-stage sampling technique was used to selected study participants. Data on demographic characteristics of infants and anthropometric measurements were collected using a structured questionnaire as a face to face interview. Data were analyzed using both WHO Anthro and SPSS software program. WHO Anthro was used to calculate the Z-score needed to determine the prevalence of malnutrition among infants. The final clear dataset are imported to SPSS.
- Results
- The mean age of infants was 4.3±3 months. 47.5% were boys and 52.5% were girls. The prevalence of wasting 11.8% is classified as "high", the prevalence of stunting 40% is classified as "very high", and the prevalence of underweight 20.3% is classified as "medium". A statistical significant difference was not found by sex regarding wasting, stunting and underweight while statistical significant difference was found by age (χ2-test, P<0.05).
- Conclusion
- The prevalence of malnutrition among infants was very serious problems in Sana'a city. Emergency nutrition programs should focus primarily on infants group.
Keywords
Full text
Introduction
The term growth refers to increase in the physical size of the body, and development to increase in skills and functions (1). Malnutrition is an important problem in all health care settings. Malnutrition can be defined as a disorder of nutritional status resulting from reduced nutrient intake or impaired metabolism hypertension (2). Good nutrition is essential for the growth and development that occurs during an infant’s first year of life (3). Infant's undernutrition is a significant health problem in developing countries and one of the major cause of disability, morbidity and mortality (4), it is ranked as the top cause of global burden of disease (5) and underlying 53% of deaths in children under five years (6). Worldwide, almost 7 million children die each year before they reach their fifth birthday (7). In Yemen, it has been clearly stated that malnutrition is a major public health concern and an underline cause of high mortality and is ranked as the most important factor among preventable factors affecting infants' healthy life (8). According to Yemen family health survey (YFHS) an estimated 53.1% of under five children suffered from stunting and 30% were severely stunted. 12.4% were suffering from wasting and 3% were severely wasted. 45.6% were suffering from underweight and 15.2% were severely underweight (9). The first years after birth are the base for quality improvement of life time (10). Therefore, follow-up and surveillance of children are vital for the health of society. Growth parameters are important tools for assessing growth of infants and young children (10). This is the first study was carried out to determine the infants' malnutrition at primary health centers in Sana'a city. The aim of the study was to determine the prevalence of malnutrition among infants attending maternal and child health centers (MCHC) in Sana'a city.
Material & Methods
Study Design: A descriptive cross-sectional survey was conducted to determine the prevalence of malnutrition among infants attending MCHC in Sana'a city-Yemen from March to May 2012.
Study population and participants: This survey was conducted among Yemeni infants aged less than one year attended to MCHC in Sana'a city. 419 infants were selected to this study. Sampling frame of all MCHC at the different districts in Sana'a city was used for the purpose of sampling. We used a random sampling methodology designed to represent MCHCs within each district. Infants of unwilling mothers and infants in the absence of their mother during data collection were excluded from the study.
Sampling technique: A multi-stage sampling technique was used.The first-stage sampling frame consisted of all districts in Sana'a city. Eight districts out of 10 were selected by simple random sampling. The second sampling stage consisted of simple random sampling of two MCHC for each selected districts that participated in the study (16 MCHC). The third stage of sampling was selecting 26 to 27 infants from each selected MCHC with a probability proportional to the MCHC enrollment size. The participants were taken daily as the caregiver which visited the MCHC to bring the infants for vaccination or follow-up.
Sample Size: The sample size has been calculated using the Epi Info software, version 7.0 (CDC, Atlantic, USA, 2009) taking into consideration the following criteria; population size of surviving Infants in Yemen as 676,710 (11); 45.6% expected frequency (prevalence of underweight in Yemen, underweight (9) and confident limit (precision) as 5%. Design effect was 1. A sample size (n) with 95% confidence interval was 381 infants. Non-response rate & extreme z-scores (flagged by Anthro software) of 10% was estimated and then the final sample size was 419 infants.
Infants were totally undressed. The caregiver was asked to remove all clothing and nappy. To improve the reliability of the measurement, weight was taken twice, with the average of two measurements used (12). Length of infant was measured by using a pocket size meter which was fixed on a hard board using the tape. The mother/caregiver of the infant was asked to remove any head covering as well as shoes and socks. The researcher with his assistance placed the infant in the supine position, ensuring that the infant’s crown was securely against the headboard. The researcher asked the mother/caregiver to keep the infant’s head in that position and one person held the knees down, while another read the measurement of the distance between the head and the feet. The length was measured in centimeters to the nearest 0.1cm according to standard measuring techniques. To improve the reliability of the measurement it was taken twice, with the average of the two measurements used (12). Before the commencement of the actual study, tools and methods were pre-tested. The pilot study was conducted over a period of one week and it included 20 participants not included in this study. After the pilot study, corrections were made where necessary.
Data analysis: Four hundred infants were admitted to the final analysis. Thirteen infants with extreme z-score values were flagged by Anthro, and 6 were refused to participate in this study, so these cases were excluded from the final analysis. The final clean data set was imported into the SPSS program. Before entering the data, a researchers checked each data sheet immediately after collecting the sheets. When he found any mistakes or blanks in the form, he contacted interviewer or examiner who was responsible for the interview and corrected the mistakes with them. All the data was recorded on questionnaire sheets. To avoid any mistakes, the data entry was done by two persons for each sheet and the two sheets were compared. When a difference was found between the two data sheets, the data entry personnel referred the original data sheet. Data analysis was conducted in both Anthro (v3.2.2, 2011) and SPSS (v18). Before launching analysis process, anthropometrical Z-scores were calculated by WHO Anthro software program, Data collection: The demographic data and the using WHO growth standards 2006 as the reference value. anthropometric measurements were collected at health centers by qualified and well-trained nurses. Structure questionnaires were used as a face to face interview with infant’s mother/caregiver. The questionnaire was consisted of demographic characteristic of infants and anthropometric measurements. Infants were weighed on a calibrated pan-type pediatric electronic scale, measuring the weight to the nearest 0.1kg, according to standard weighing procedures. We used three anthropometric indicators to assess infant’s nutritional status: weight-for-age (W/A), length-for-age (L/A) and weight-for-length (W/L) based on WHO 2006 Growth Standards (13) and deficits found classified infants as follows: wasting (Global acute malnutrition) was W/L <-2 Z-score ( W/L < -3 Z-scores = sever wasting and W/L ≥ -3 Z-Scores and < -2 Z-Scores = moderate wasting). The classification used for stunting was: L/A <-2 Z-score (L/A < -3 Z-Scores = severe stunting and L/A ≥ -3 Z-Scores and < -2 Z-Scores = moderate stunting). The classification used for underweight was: W/A <-2 Z-score (W/A < -3 Z- Scores = severe underweight and W/A ≥ -3 Z-Score and <-2 Z-Scores = moderate underweight).
The classification of severity of malnutrition was based on WHO guidelines for assessing malnutrition as a follows (14). Wasting: Low: <5%, medium: 5-9%, high: 10-14% and very high: ≥15%, Stunting: Low: <10%, medium: 10- 19%, high: 20-29% and very high: ≥30% and Underweight: Low: <20%, medium: 20-29%, high: 30-39% and very high: ≥40%. Descriptive and inferential statistics were done and the data were presented as frequency and percentage. Person's x(2) test was used for categorical variables and to analyze difference in proportions. Statistical significance was considered when p value <0.05.
Ethical Considerations: The study was initially approved by the local health authorities in Sana'a city. Purpose and benefits of the survey were explained to caregivers and assured that their responses would not influence their care. Oral informed consent has obtained from all caregivers whom infants enrolled in our study.
Demographic characteristics of infants: Four hundred infant aged less than one year were included in our study, of whom 190 (47.5%) were boys and 210 (52.5%) were girls. The mean age was 4.3±3 months (4±2.96 month for boys and 4.63±3.08 month for girls). Ninety eight percent of infants were urban residence place. Regarding the birth order, most infants (42%) were second or third born.
Results
Prevalence of malnutrition: In the present survey, the three forms of malnutrition (wasting, stunting, and underweight) are defined independently based on 2006 WHO growth standards.
Prevalence of wasting (Global Acute Malnutrition): The prevalence of wasting was 11.8% (CI: 8.5%-15%) of which 7.3% (CI: 5.1%-10.2%) of infants were of moderate acute malnutrition (MAM) and 4.5% (CI: 2.3%-6.7%) were severe acute malnutrition (SAM) (Figure 1).
Prevalence of stunting (Chronic Malnutrition): The prevalence of stunting was 40 percent (95% CI: 35.1%, 44.9%) of which 21% (95% CI: 17%, 25%) of infants were moderately stunting and 19.3% (95% CI: 15.3%, 23.2%) were severely stunting (Figure 2).
Prevalence of Underweight: The prevalence of underweight was 20.3% (95% CI: 16.2%, 24.3%) of which 15.3% (95% CI: 12%, 19.1%) of infants were moderately underweight and 5% (95% CI: 2.7%, 7.3%) were severely underweight (Figure 3).
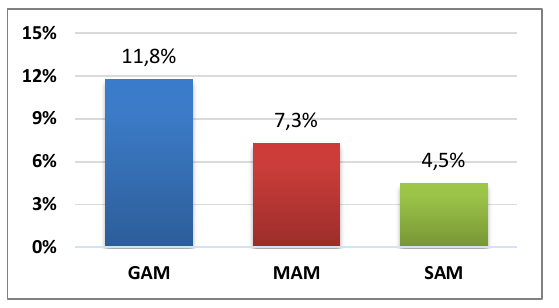
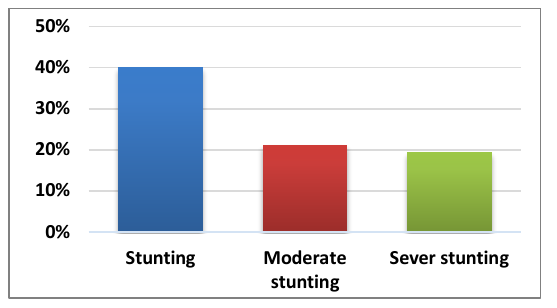
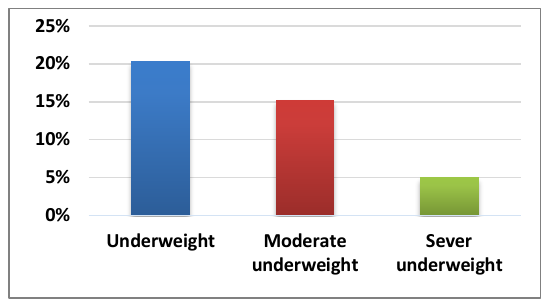
Prevalence of malnutrition among infants by sex and age
The prevalence of wasting among boys was 13.7% whereas 10% among girls. Out of 210 girls, 85 (40.5%) were stunted while out of 190 boys, 75 (39.5%) were stunted. The prevalence of underweight among boys was 19.5% and among girls was 21%. A statistical significant difference was not found by sex regarding wasting, stunting and underweight (χ(2)-test, P>0.05).
As regard to prevalence of malnutrition by age, the prevalence of wasting among infants who aged 6-11 months were slightly higher than infants' age ranged 0-5 months (15.8% vs. 10.4% respectively). The prevalence of stunting was higher (51.5%) among infants with aged 6-11 months than aged 0-5 months (36.1%). The prevalence of under weight was higher (25.7%) among infants aged 6-11 months than infants aged 0-5 months (18.4%). Statistical significant difference was found by age (χ(2)-test, P<0.05) (Table 1).

Prevalence of the severity of malnutrition among infants
Based on the classification developed by WHO, the prevalence of global acute malnutrition (wasting) in the present study is classified as “high” [11.8% (95% CI: 8.5%, 15%)], the prevalence of chronic malnutrition (stunting) is classified as “very high” [40% (95% CI: 35.1%, 44.9%)], and the prevalence of underweight is classified as “medium” [20.3% (95% CI: 16.2%, 24.3%)](Table 2).

Discussion
Knowing the prevalence rates of underweight, wasting, and stunting is important for determining the overall health of the community and for monitoring achievements toward mid-decade goals for nutrition and child health set by WHO (15). Malnutrition problem in Yemen is a long standing concern, with increasing trend reported since 1997, for both stunting which represents the chronic nature of the problem, and wasting which reflects the on-going acute situation which the overall percentages exceeded the emergency threshold nationwide (16).
Low weight-for-height, known as wasting, or acute malnutrition is reflected by a low body mass relative to age and is classified when the Z-score is below median by -2SD. Low weight-for-height by a percentile lower than -3SD are regarded as severe wasting (17). This is as a result of acute starvation and disease, which results in severe malnutrition, with implications of acute malnutrition in a chronically stunted child. Wasting is a strong predictor of mortality among children under five. It is usually the result of acute significant food shortage and/or disease (18). Our survey found that the overall GAM prevalence was 11.8%, which is classified as ‘high’ according to WHO (14). However, the acute malnutrition rate found in this survey was lower the prevalence found for Al Hodeidah by the Food Security Baseline Survey (19) and Yemen demographic and Maternal and Child health survey (YDMCHS) (16), International Food Policy Research Institute (20) estimations based on 2005-06 Household Budget Survey (HBS), SOWC (21), Hajjah survey (22) and Lahaj survey (23), while it is higher than Taiz survey (24) and Sana’a, Ibb and Hadhramout survey (25). Similarly, the level of wasting found in this study is also lower than the prevalence found by the World food Program (WFP) in Yemen (26).
This finding is higher as compared to the 5% obtained from a survey done in Zambia, 9% in Ethiopia, 8.2% in Aydin province of Turkey and the 6% in Ghana (27–30). The present study revealed that 11.8% of the infants having GAM however, in UNICEF report (18), it is stated that countries with 10% or more wasted under-fives require urgent response. Since 11.8% is far from 10% there is a need for an intervention.
Low length-for-age is referred to as stunting and occurs when the Z-score is below the median by more than -2SD (14). Stunting is seen as a failure to reach linear growth and is prevalent in children with long-term insufficient nutrient intake and frequent infections. If a child is stunted before the age of two, then irreversible effects of poor motor and cognitive development occur. Stunting is a public health problem worldwide. It is a measure of cumulative deficient growth and a feature of a complex syndrome including developmental delay, impaired immune function, reduced cognitive development, metabolic disturbance leading to accumulation of body fat, loss of lean mass, and risk of hypertension (31). According to WHO, stunting rates of less than 20% are low, stunting rates between 20-29% indicate the situation is medium, GAM rates between 30-39% are high, while stunting rates of 40% and above are very high and indicate an emergency situation (14). The prevalence of stunting found in this survey was 40%, far exceeding the critical level thresholds of 30%. The results indicate an emergency nutrition situation in the Sana'a city based on the stunting level, hence a need for emergency response to avert excess mortality due to malnutrition. The stunting rates call for integrated response to reduce the prevalence and the resultant longer-term effect of stunting (infants not reaching their full potential in productivity; population might record excess mortality). In our study the prevalence of sever stunting was 19.3%. This result was higher than found in Taiz survey (24), which the level of severe stunted is 17.1%. The prevalence of stunting occurs amongst one-third of the world's children (18).
The erratic growth patterns and growth faltering, especially the high prevalence of stunting in the infant sample, causes huge concern. Stunting is considered a consequence of chronic poor nutrition and is associated with developmental delay and impaired cognitive function. It is considered to be the strongest predictor of child mortality in children younger than five years. Evidence also shows that growth faltering, especially stunting, adversely affects a child’s quality of life, particularly at the onset of adolescence (32). The prevalence of stunting in our survey is lower than reported from Hodeidah survey (33), the IFPRI estimations 2010 and SOWC (21), but is slightly lower than figures from Hajjah survey (22) . The prevalence of stunting in our study is much higher than the findings of the two community-based studies in South African, 22.1% and 26.9% of infants were stunted (34, 35). However, 40% prevalence of stunting revealed in our findings is higher compared to 38.7% in Botswana (36).
Underweight is reversible and reflect either acute or chronic malnutrition (37). The child becomes underweight because of poor food quality and quantity (18). The W/A z-score of the infants in our survey showed a variety of erratic growth patterns ranging from catch-up growth, moderate growth faltering to severe weight loss. The prevalence of underweight in our survey was 20.3%, classified as ‘high’ according to WHO classification (14). Furthermore, this also indicates that the proportion of underweight is far above the 2015 MDG target of 15%. It is worth noting that underweight is a composite variable for acute malnutrition and chronic malnutrition levels in a population. The prevalence of underweight in the present survey was approximately similar to the figures from Aden survey but higher than Al-Maharah survey (38). Our result was lower the figures from Hodeidah survey (19), the SOWC (21) and Hajjah survey (22). Also, the prevalence of underweight in our survey was lower than found in the governorates of Al- Dhaleah, Amran (20) and Al-Hodeidah survey (33). Nevertheless, the prevalence of underweight in our survey may call for more explanation on the variation from the national figure and may reflect a local trend for Sana'a city. Moreover, our findings are higher than Ghana study which found that, 18.3% of infants are underweight (30) and much higher when compared to the findings of the study done in Aydin province of Turkey which showed a prevalence of 4.8% for underweight (29).
Conclusion
Malnutrition among infants was very serious problems in Sana'a city. The prevalence of global acute malnutrition was 11.8%, which is classified as ‘high’ according to WHO classification. The prevalence of stunting was very high and above the WHO ‘critical’ level thresholds of 40%. The prevalence of underweight (20.3%) was classified as ‘high.
Recommendations
The government is urged to strengthen the capacity of the health service provision at a community level in order to promote the education of the parents about the appropriate infant feeding. Further researches are recommended into underlying factors related to malnutrition.
Declarations
- Author contributions (CRediT)
- All authors contributed equally to all 14 CRediT roles (Conceptualization, Data curation, Formal analysis, Funding acquisition, Investigation, Methodology, Project administration, Resources, Software, Supervision, Validation, Visualization, Writing – original draft, Writing – review & editing).
- Funding
-
Funding information was not reported in the published version of this article.
- Conflicts of interest
- A conflict of interest statement was not reported in the published version of this article.
- Ethics approval
- The study was initially approved by the local health authorities in Sana'a city. Purpose and benefits of the survey were explained to caregivers and assured that their responses would not influence their care. Oral informed consent has obtained from all caregivers whom infants enrolled in our study.
- Data availability
- A data availability statement was not reported in the published version of this article.
References (39)
12 of 39 references are linked to their DOI.
- Park, K. Park’s Textbook of Preventive and Social Medicine. 19th. Jabalpur: M/S Banarsidas Bhanot Publishers, 504. PubMed Google Scholar
- Harris M, Ross EB, 2007. PubMed Google Scholar
- August ve Kushner, RF. The 1995 ASPEN standards for nutrition support: hospitalized. 1995. DOI Crossref PubMed Google Scholar
- Klawitter, BM. Nutrition Assessment of Infants and Children. N Nevin-Folino. Pediatric Manual of Clinical Dietetics, 2nd ed. Chicago: American Dietetic Association, 2003; 145-161. PubMed Google Scholar
- Kumar et al. Influence of infant- feeding practices on nutritional status of under five children. Indian J Pediatr. 2006, 73(5):417-421. DOI Crossref PubMed Google Scholar
- Ezzati et al. Selected major risk factors and global and regional burden of disease. The Lancet. 2002, 360(9343):1347-1360. DOI Crossref PubMed Google Scholar
- Bryce et al. WHO estimates of the causes of death in children. 365(9465):1147, 2005. DOI Crossref PubMed Google Scholar
- You et al. Level and trend in child mortality. Report 2012. 2011. PubMed Google Scholar
- Sunil, T.S. Effects of socio-economic and behavioural factors on childhood malnutrition in Yemen. Maternal and Child Nutrition. 2009,5, 251–259. DOI Crossref PubMed Google Scholar
- YFHS. Yemen Family Health Survey, Principal Report. Sanaa: MoPHP, Central Statistical Organization Yemen and League of Arab Sector, 2003. Al-Rabeei, et al. Malnutrition Among Infants PubMed Google Scholar
- El Mouzan et al. Pattern of Sex Differences in Growth of Saudi Children and Adolescents. 7, 2010, Vol 1. DOI Crossref PubMed Google Scholar
- Central Statistical Organization. National Census, Yemen. Yemen Republic: Ministry of Planning and International Cooperation, 2010. PubMed Google Scholar
- Lee, RD ve Nieman, DC. Nutritional Assessment. Third Ed. New York: McGraw -Hill Higher Education, 2003:164-167. PubMed Google Scholar
- WHO. Child Growth Standards: Length/height-for-age, weight-for-age, weight-for-length, weight-for-height and body mass index-for-age: Methods and development. World Health Organization Department of Nutrition for Health and Development, 2006. DOI Crossref PubMed Google Scholar
- World Food Programme, United Nations System Standing Committee on Nutrition, United Nations Children's Fund, Community-based management of severe acute malnutrition. 2007. http://www.who.int/nutrition/topics/statement_commbased_malnut rition/en/index.html. PubMed Google Scholar
- Measuring Progress towards Health Millennium Development Goals. Geneva: World Health Organization, 2006. PubMed Google Scholar
- YDMCHS. Yemen Demographic and Maternal and Child Health Survey-II (YDMCHS-II). Central Statistical Organization, Ministry of Public Health and Population, Yemen Republic, 1997. PubMed Google Scholar
- WHO. Global database on child growth and malnutrition. World Health Organization/Program of Nutrition, 2004. PubMed Google Scholar
- UNICEF. Progress for Children: A world fit for Children Statistical Review. 4. New York: 2007. PubMed Google Scholar
- MoPIC. Food Security Baseline Survey 2010.Central Statistical Organization, Government of Yemen. 2011. PubMed Google Scholar
- MoPIC&IFPRI. National Food Security Strategy Paper (NFSSP). Final Draft, Yemen. Ministry of planning international and cooperation (MoPIC) and International Food Policy Research Institute (IFPRI), 2010. PubMed Google Scholar
- UNICEF. The state of the world’s children - Special Edition. New York: 2010. PubMed Google Scholar
- MoPHP&UNICEF. Nutrition Survey among U5 Children and Women of Childbearing Age in Three Districts in Hajjah Governorate, Yemen. 2011. PubMed Google Scholar
- MoPHP & UNCEF. Nutrition and Mortality Survey in Low Land and Mountainous Ecological Zones of Lahaj Governorate, Yemen. 2012. PubMed Google Scholar
- MoPHP&UNICEF. Nutritional Survey in Mountainous and Coastal Plain Nutrition Survey in Taiz Governorate, Yemen. 2012. PubMed Google Scholar
- MoPHP&JICA. Nutritional Status of Children and Mothers in Selected Communities in Sana’a, Hadhramout Governorates, Yemen. Ministry of Public Health and Population Yemen and Japan international cooperation agency (JICA), 2009. PubMed Google Scholar
- WFP. Executive Brief: Yemen, Comprehensive Food Security Survey (CFSS) 2009/2010. World food Program (WFP), available at http://www.wfp.org/food-security, 2010. PubMed Google Scholar
- ANON. Nutrition of young children and mothers in Zambia: Findings from 2001-2002 Zambia Demographic and Health Survey. USA, Measure DHS program, 2003. PubMed Google Scholar
- Nutrition of young children and mothers in Ethiopia: Findings from 2001-2002 Ethiopia Demographic and Health Survey. USA, Measure DHS+ program, 2003. PubMed Google Scholar
- Ergin et al. Nutritional status and risk factors of chronic malnutrition in children under five years of age in Aydin, a western city of Turkey. Turk J Pediatr. 2007, 49(3): 283-9. DOI Crossref PubMed Google Scholar
- Vida, Ntiwaa Gyasi. The influence of feeding practices on nutritional status of children (0-23 months) in the Bibiani-Anhwiaso-Bekwai district of Ghana. (Master thesis in public health to the school of graduate studies, Ghana). 2008. PubMed Google Scholar
- Martins PA, H. D., et al., et al. Stunted children gain less lean body mass and more fat mass than their non-stunted counterparts: a prospective study. Br J Nutr 92(8): 819-25. 2004. DOI Crossref PubMed Google Scholar
- Newell ML, Borja MC ve Peckham, C. European Collaborative Study Height, weight, growth in children born to mothers with HIV-1 infection in Europe. Pediatrics. 2003, 111:52-60. DOI Crossref PubMed Google Scholar
- MoPHP. Nutrition Survey among U5 Children in Hodeidah Governorate, Yemen. MoPHP, 2011. PubMed Google Scholar
- Faber, M, Wenhold, F. Nutrition in contemporary South Africa. Water South Africa, 2007, 33(3):393-399. PubMed Google Scholar
- DoH. National Food Consumption Survey Fortification Baseline South Africa, 2005 ExecutivSummary, Department of Health South Africa. South African Journal of Clinical Nutrition. 2008:21(3):255-266. PubMed Google Scholar
- Mahgoub, N. M, ve Bandeke, T. Factors affecting prevalence of malnutrition among children under three years of age in Botswana. African Journal of Food, Agriculture, Nutrition and Development. 2006:6(1): 15. DOI Crossref PubMed Google Scholar
- UNICEF. Tracking Progress on Child and Maternal Nutrition: a survival and development priority. New York: United Nations Children’s Fund, 2009. ISBN 978-92-806-4482-1. PubMed Google Scholar
- Al-Arhabi. The Second National Millennium Development Goals Report. MoPIC and UNDP Yemen Report, 2010., How To Cite? DOI Crossref PubMed Google Scholar
Respond to this article
Comments on a published article are welcome as a Letter to the Editor.
Get an e-mail when new articles in your fields are published
Questions to the authors
Questions are moderated: an editor approves each question, the authors answer, and an editor approves the answer before both appear here.
No answered questions yet.
Ask the authors a question
Discussion
Comments are moderated: they appear after the writer confirms the e-mail address and an editor approves them. Each comment carries a conflict-of-interest statement.
No comments yet.
Write a comment
Tell me when this article is cited
Leave your e-mail address and confirm it. These notices are not being sent yet; your confirmed address is kept for them and used for nothing else.
Read the full text
Open the PDF here
Loading the PDF…
If the PDF does not show here, use the download button above.
How to cite this article
Al-Rabeei NA, Dallak AM, Al-Barakani MH. Prevalence of malnutrition among infants in Sana'a city, Yemen. Ulutas Med J. 2015;1(1):1-6. doi:10.5455/umj.2015.1.1
Al-Rabeei, N. A., Dallak, A. M., & Al-Barakani, M. H. (2015). Prevalence of malnutrition among infants in Sana'a city, Yemen. The Ulutas Medical Journal, 1(1), 1–6. https://doi.org/10.5455/umj.2015.1.1
Al-Rabeei, N.A., Dallak, A.M. and Al-Barakani, M.H. (2015) 'Prevalence of malnutrition among infants in Sana'a city, Yemen', The Ulutas Medical Journal, 1(1), pp. 1–6. doi: 10.5455/umj.2015.1.1.
@article{umj182504,
  title = {Prevalence of malnutrition among infants in Sana'a city, Yemen},
  author = {Al-Rabeei, Nabil Ahmed and Dallak, Abdulsalam Mohammed and Al-Barakani, Mustafa Hasan},
  journal = {The Ulutas Medical Journal},
  year = {2015},
  volume = {1},
  number = {1},
  pages = {1--6},
  doi = {10.5455/umj.2015.1.1},
  url = {https://www.ulutasmedicaljournal.com/?mno=182504},
  issn = {2149-388X}
}