The Ulutas Medical Journal · ISSN 2149-0430 (print), 2149-388X (online) · https://www.ulutasmedicaljournal.com/?mno=282921
Original Article · Open access
The Relationship Between Food Neophobia, Food Technology Neophobia and Anthropometric Measures in Adults: A Web-Based Study
Also available in: العربية · Türkçe · 中文
- Department of Nutrition and Dietetics, Faculty of Health Science, Kırklareli University, Kırklareli, Türkiye ROR
Abstract
- Background
- This study aims to assess the level of food neophobia (FN) among individuals in Turkey and to examine the relationship between eating attitudes and food-technology neophobia.
- Methods
- This cross-sectional study was announced online between June and August 2022. Demographic information was collected alongside the Food Neophobia Scale (FNS), the Food Technology Neophobia Scale (FTNS), and the Eating Attitude Test-26 (EAT-26).
- Results
- A total of adult participants (n=489, age:18–68) completed the online survey. A positive statistically significant correlation was found between FNS total and FTNS total (r:0.227, p=0.000). As FN increases, FTN increases as well. No statistically significant difference was found between the FNS-willingness to try new foods subscale and the EAT-26 and its subscales (p>0.05).
- Conclusion
- This study contributes to the promotion of FNS and FTNS. Language and cultural differences limit the indiscriminate use of scales, and changes and adaptations are required to broaden their use. Further research is needed to explore the causal mechanisms underlying these relationships and to develop interventions that promote both eating behavior and food neophobia.
Keywords
Full text
Introduction
Food choice plays an essential role in affecting the variety and quality of nutrition we consume in daily life (1). The tendency to avoid new or unfamiliar foods, to varying degrees, is defined as food neophobia (2–4). In another definition, it is described as personal reluctance to accept and/or enjoy new or unfamiliar foods (5). While living beings are willing to try new foods to meet the nutritional needs, they simultaneously avoid new foods due to the possible harmful effects of foods. Even if adaptation to poisoning from unknown foods is achieved, it may impose restrictions on dietary diversity (2). While new and unfamiliar foods generally attract societal interest, some individuals approach them with caution (3). While individuals' willingness to consume foods they know is only related to their liking (6), their willingness to consume new foods is related not only to liking but also to the danger potential of the food (2). Food choice plays an essential role in daily life and in the quality and variety of foods we consume. Food neophobia is often a persistent personality trait that manifests with reluctance to try and even a fear of trying unknown foods. It is common in childhood and may extend into adulthood (7). While food neophobia is prevalent among preschool children and elderly individuals, young people are more open to trying new foods (8, 9). Research shows that food neophobia is more common among males (10). Additionally, educational status also affects the tendency toward food neophobia (11). High food neophobia was discovered in patients with celiac disease and phenylketonuria (12). Soucier et al. (2019) reported that individuals aged 65 and older exhibit high food neophobia and are reluctant to try new foods (12). Additionally, the prevalence is higher among individuals living in rural areas (9, 13). Research conducted on university students revealed that food neophobia scores ranged between 22 and 37.3. These scores were considered neutral (1, 9, 13–15). Food neophobia varies from country to country and directly reduces nutritional quality and diversity. The reduction in dietary diversity leads to restricted food intake (15).
Food neophobia is also defined as a defense mechanism (3). Previous studies have reported that neophobic individuals consume less poultry, fish, salads, and vegetables. Studies in the literature show that as food neophobia increases, consumption of food groups such as fish, poultry, vegetables, and fruits decreases, supporting the effect of this fear on dietary diversity (2). Consequently, limited nutritional diversity results in inadequate intake of macro-nutrients and micronutrients, including protein, magnesium, and monounsaturated fatty acids (MUFAs) (1). Hursti and Sjöden (1997) state that food neophobia can be reduced in an individual by frequently feeding them the food they hesitate to eat (16).
Pliner and Hobden (1992) developed the Food Neophobia Scale (FNS). The total score is used to assess a person's state level of food neophobia and their tendency to try unknown foods. The 10-item Food Neophobia Scale (FNS) was developed and validated with Canadian undergraduate students in English form (17). The scale has been translated into Finnish, Italian, French, European Portuguese, Brazilian Portuguese, and Chinese, and validity and reliability studies were conducted in these languages as well (2, 17). The T-FNS is valid and reliable for adults in Turkish society (2).
Food neophobia can also negatively affect specific food manufacturing industries (1). There is substantial evidence consumers are cautious about new foods and related technologies. For example, when applied to food, known transgenic technologies (genetic modification, GM) elicit high perceived risk and reluctance among consumers. Interest and reluctance toward a wide variety of food technologies are observed in various populations (5). There is a trend toward natural products and a reaction to technology (18). The acceptability of products produced using food technologies may vary according to individual and cultural variables, geographical location, and religion (12).
On this basis, the Food Technology Neophobia Scale, a new psychometric tool for consumer acceptance of new foods, was developed. Cox and Evans (2008) developed and validated a psychometric scalemeasuringFood Technology Neophobia (FTNS) (12); thus, researchers will be able to determine the acceptance limits of foods that may contain benefits, and more importantly, this study will test the relationship between FTNS and behavioral responses to foods using new technologies (8).
On the other hand, eating attitudes are defined as thoughts toward nutrition and eating. Eating disorders are among the most studied topics in the field, both in clinical populations and in university and high school samples. Research has shown that disturbed eating attitudes are associated with various psychological problems and disturbed eating behaviors. Additionally, the selection of target groups, prevention of eating disorders, and investigation of risky eating attitudes are prominent factors in studies. Therefore, prevention of attitudes before they emerge is possible and essential. The Eating Attitudes Test (EAT), developed by Garner and Garfinkel (1979) and adapted into Turkish by Savaşır and Erol (1989), is widely used to assess risk-taking eating attitudes. The 26-question short form of the scale offers advantages in psychometric properties, economy, and practicality. Additionally, the scale has been translated into many languages and is used worldwide.
Although there is limited published information on eating attitudes and food neophobia, we hypothesized that the Turkish version of T-FNS may be associated with FTNS, EAT-26, and anthropometric measures.
Materials and Methods
Design and sample
This cross-sectional study was advertised online via social media platforms and recruited individuals who agreed to participate. Research data were collected between June and August 2022. Following examination of the surveys, individuals who met the study criteria and completed the forms completely were included in the study. In G*Power 3.1.9.4, the minimum sample size required to detect an effect size of d=0.15, based on correlation analysis at 90% statistical power (1-β error probability) and α=0.05, was calculated as 459 (19, 20). A total of 489 adult volunteers aged 18-68 residing in Turkey who completed the questionnaires wholly and correctly, knew Turkish, and used social media, meeting the inclusion criteria, were included. The study was deemed ethically appropriate by the Scientific Research and Publication Ethics Committee, as evidenced by the letter dated 17.06.2022 from the Rectorate of Kırklareli University. It was conducted in accordance with the principles of the Declaration of Helsinki. Scale usage permissions were obtained from the scale owners.
Demographic information
In the demographic information section, data on age, gender, marital status, educational status, smoking and alcohol use, number of meals, appetite status, and eating-out status were collected. Self-reported data were used to measure weight, height, and waist circumference. BMI and waist circumference measurements were calculated according to WHO data.
T-FNS
The FNS developed by Pliner and Hobden in 1992 is a 10-item Likert-type scale. Each item contains seven categories ranging from "strongly disagree" (1 point) to "strongly agree" (7 points). Five items in the scale (items 1, 4, 6, 9, and 10) are reverse scored, yielding a total score between 10 and 70, with high scores associated with the presence of food neophobia. The scale adapted into Turkish by Uçar et al. in 2021 has subscales named "willingness to try new foods" and "trusting new foods." The Cronbach's alpha coefficient of the T-FNS scale was found to be 0.805, and the T- FNS scale was found to be valid and reliable for adult individuals in Turkish society (2). Additionally, Duman et al. (21) conducted a scale translation study in 2019 and found the Cronbach's alpha value to be 0.614. In our study, the Cronbach's alpha value of the scale was found to be 0.763. High scores indicate food neophobia. There is no cut-off point.
EAT-26
The Eating Attitudes Test is a frequently used instrument for assessing eating disorders. The Eating Attitudes Test (EAT-40), originally developed in English, was created in 1979 by Garner and Garfinkel (22) as a self-assessment scale that objectively measures symptoms of anorexia nervosa and bulimia nervosa. The Eating Attitudes Test-26 was developed from the original 40-item EAT-40. The test consists of three factors in total: 1)Dieting (items 1,6,7,10,11,12,14,16,17,22,23,24 and 26), 2)Bulimia and food concern (items 3,4,9,18,21, and 25), and 3)Oral control (items 2,5,8,13,15,19, and 20). The total score of the test ranges from 0-53. Twenty points have been set as the cutoff for the test. If the total score is below 20, it is classified as "normal eating behavior," and if 20 or above, it is classified as "abnormal eating behavior" (60). In the study, the internal consistency coefficient (Cronbach's alpha) of the scale was 0.84. In our study, the Cronbach's alpha for the scale was 0.878. The Turkish validity of the Eating Attitudes Test-26 was conducted by Okumus et al. (23) in 2019.
The Food Technology Neophobia Scale
The scale that attempts to measure new food technologies based on FNS was developed by Cox and Evans in 2008 for individuals aged 18- 65. The FTNS scale is a 13-item, 4-factor, 7-point Likert-type scale. It was designed based on responses from approximately 1,000 Australian consumers. Each item contains seven categories ranging from "strongly disagree" (1 point) to "strongly agree" (7 points). The score obtainable from the scale ranges from 13-91. It consists of four factors: New food technologies, unnecessary risk perception, healthy choice, information/media, etc. It was later retested (2010) to test its reliability and was found to be stable over time (24). Items 11, 12, and 13 are reverse-coded (24). Although there is no specific cut-off point, high scores obtained from the scale indicate high food technology neophobia. Additionally, some authors have converted the scale from the original 7-point Likert to a 5-point Likert. Cronbach's alpha was 0.83 (7). In our study, the Cronbach's alpha for the scale was 0.717. Kahriman and Baş adapted the FTNS scale into Turkish in 2024. They reported a Cronbach's alpha coefficient for the scale, adapted to 12 items and three factors, of 0.826 (24). Additionally, Ergin and Güzel (2024) adapted the scale into Turkish and reported a Cronbach's alpha of 0.92 (12).
Analysis of data
In the analysis, descriptive statistics, including frequency (n), percentage (%), mean (M), and standard deviation (SD), were used. Reliability was assessed using Cronbach's alpha, and the results were evaluated. Distribution normality was tested according to Skewness and Kurtosis values. For parametrically distributed data, Student's t-test was used to compare two independent group means, and One-Way Analysis of Variance was used to compare three or more independent group means. The relationship between two continuous variables was investigated with Pearson correlation analysis. Data were analyzed in the Statistical Package for the Social Sciences version 26.0 (SPSS 26) statistical package program. The significance level was set at p<0.05. In G*Power 3.1.9.4, the minimum sample size required to detect an effect size of d=0.15, based on correlation analysis at 90% statistical power (1-β error probability) and α=0.05, was calculated as 459 (19, 20). At the end of the study, 489 volunteers aged 18 and above who met the inclusion criteria were recruited. The hypotheses formed are as follows:
H1: There is a difference in food neophobia level according to gender - H2: The food neophobia scale and its sub-dimensions are related to anthropometry - H3: The food neophobia scale is related to eating attitudes and the food technology neophobia scale.
Results
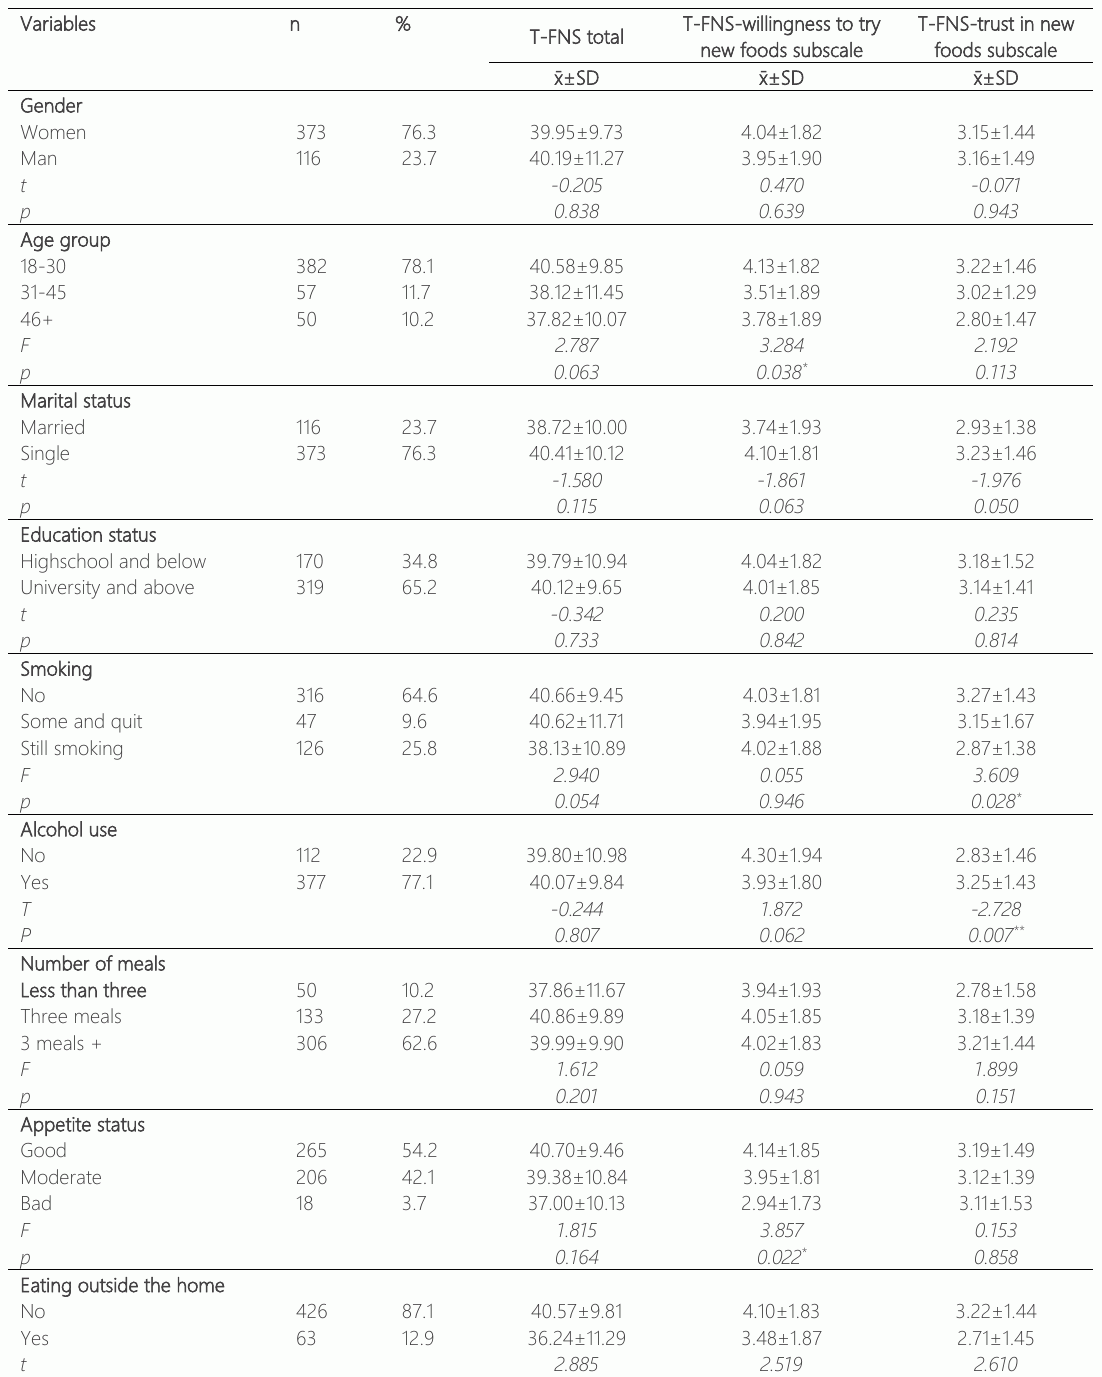
Table 1 presents the distribution of participants' descriptive characteristics and the comparisons across the Food Neophobia scale total and sub-dimensions. Among the research group, 76.3% were female, 78.1% were aged 18-30, 76.3% were single, and 65.2% had completed university or higher education. It was determined that 25.8% of the group currently smoked, and 77.1% used alcohol. It was determined that 62.6% of adults consumed more than three main and/or snack meals, 54.2% reported good appetite, and 87.1% ate outside the home.
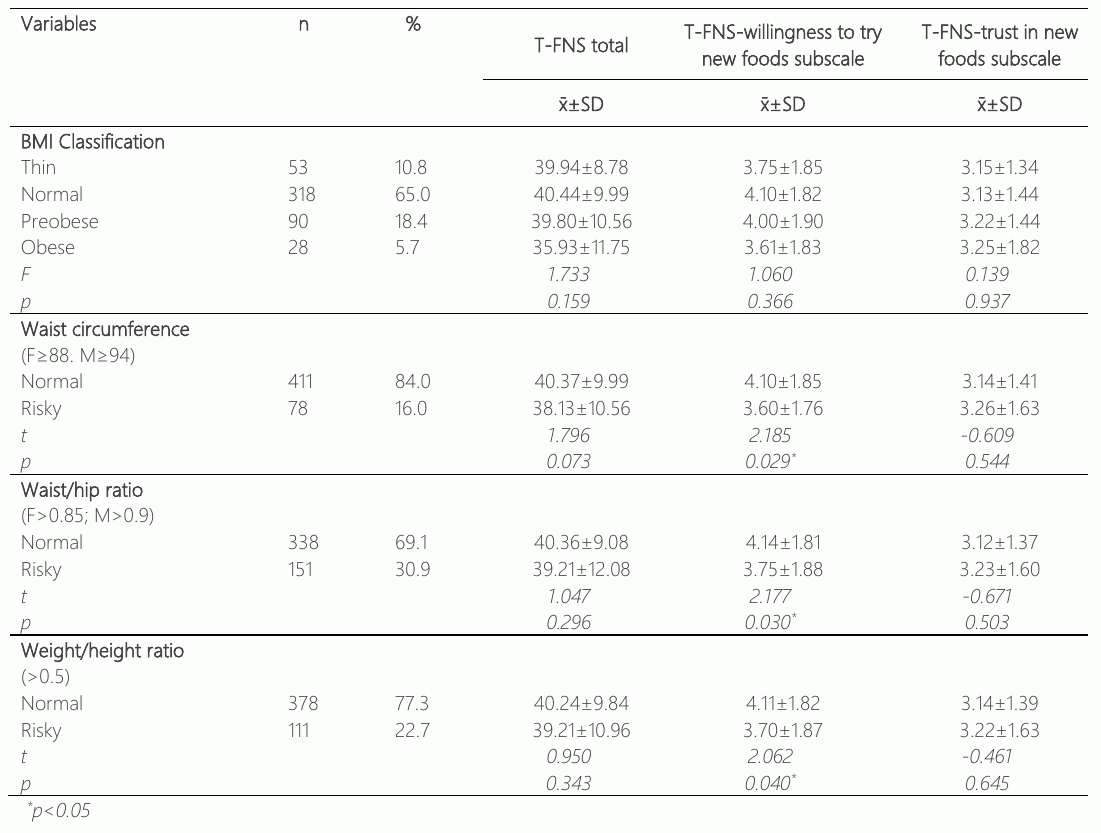
The Food Neophobia scale total scores for participants who ate outside the home were lower (p=0.005). Significant differences were found in the Food Neophobia willingness-to-try-new-foods subscale score averages across age groups (p=0.038), appetite status (p= 0.022), and eating outside the home (p=0.012). Willingness to try foods was significantly higher in the 18-30 age group than in the 31-45 age group. Trusting new foods was considerably higher in non-smokers compared to smokers. Significant differences were determined between Food Neophobia trusting new foods subscale score averages and smoking (p=0.028), alcohol use (p=0.007), and eating outside the home (p=0.009) (Table 1). Trusting new foods was found to be significantly higher in alcohol users compared to non-users. Those with a good appetite had a substantially greater willingness to try new foods than those with a poor appetite. Those who did not eat outside the home had significantly higher levels of developing neophobia toward new foods, willingness to try new foods, and trusting new foods compared to those who ate outside. Table 2 presents the distribution of participants' anthropometric characteristics and their comparison according to the Food Neophobia scale total and sub-dimensions. It was found that 65.0% of the research group had a normal BMI, 84.0% had a normal waist circumference, 69.1% had a normal waist-to-hip ratio, and 77.3% had a normal waist-to-height ratio. The Food Neophobia willingness-to-try-new-foods subscale score averages were statistically significantly lower among individuals in the risk group for waist circumference (p=0.029), waist- to-hip ratio (p=0.030), and waist-to-height ratio (p=0.040). In other words, those with waist-to-height ratios, waist circumference, and Individuals with waist-hip ratios within normal limits are more willing to try new foods than those at risk. There were no differences in Food Neophobia scale total score averages, trusting new foods subscale score averages, or anthropometric measurements (p>0.05).
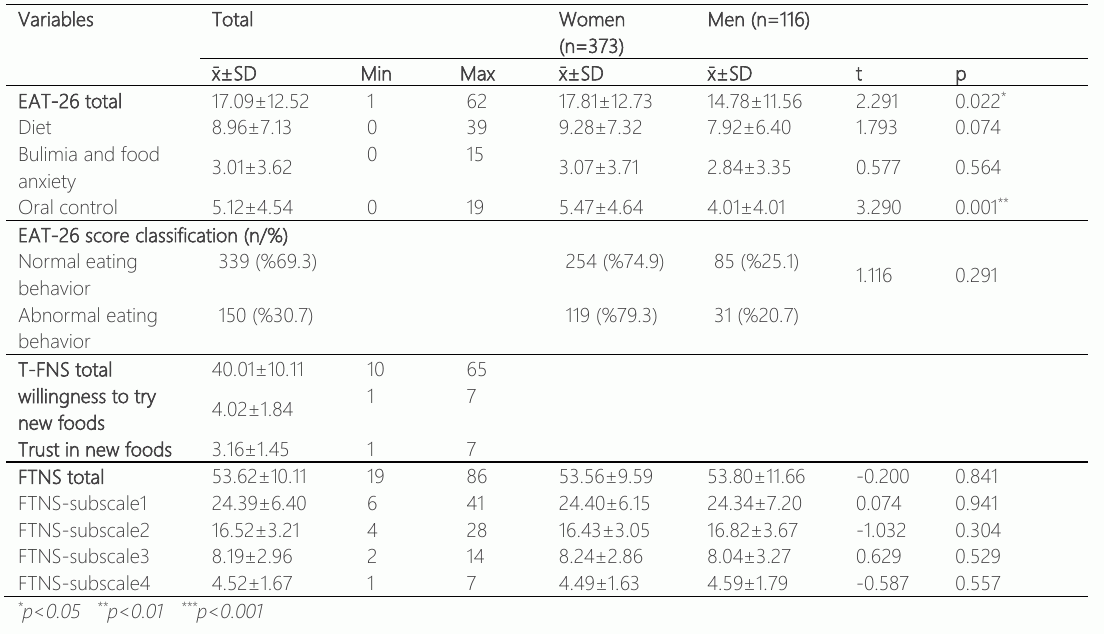
Table 3 presents the distribution of individuals' T-FNS, EAT-26, and FTNS scale and subscale score averages by gender. EAT-26 total, diet, bulimia, and food concern, and oral control sub-dimension score averages were found to be 17.09±12.52, 8.96±7.13, 3.01±3.62, and 5.12± 4.54, respectively. EAT-26 total (p=0.022) and oral control (p=0.001) score averages were determined to be significantly higher in women compared to men. No differences were found in the average scores for the diet, bulimia, and food concern sub-dimensions by gender (p>0.05).According to the EAT-26 classification, abnormal eating behavior was identified in 30.7% of participants, but no difference was observed between genders (p>0.05).
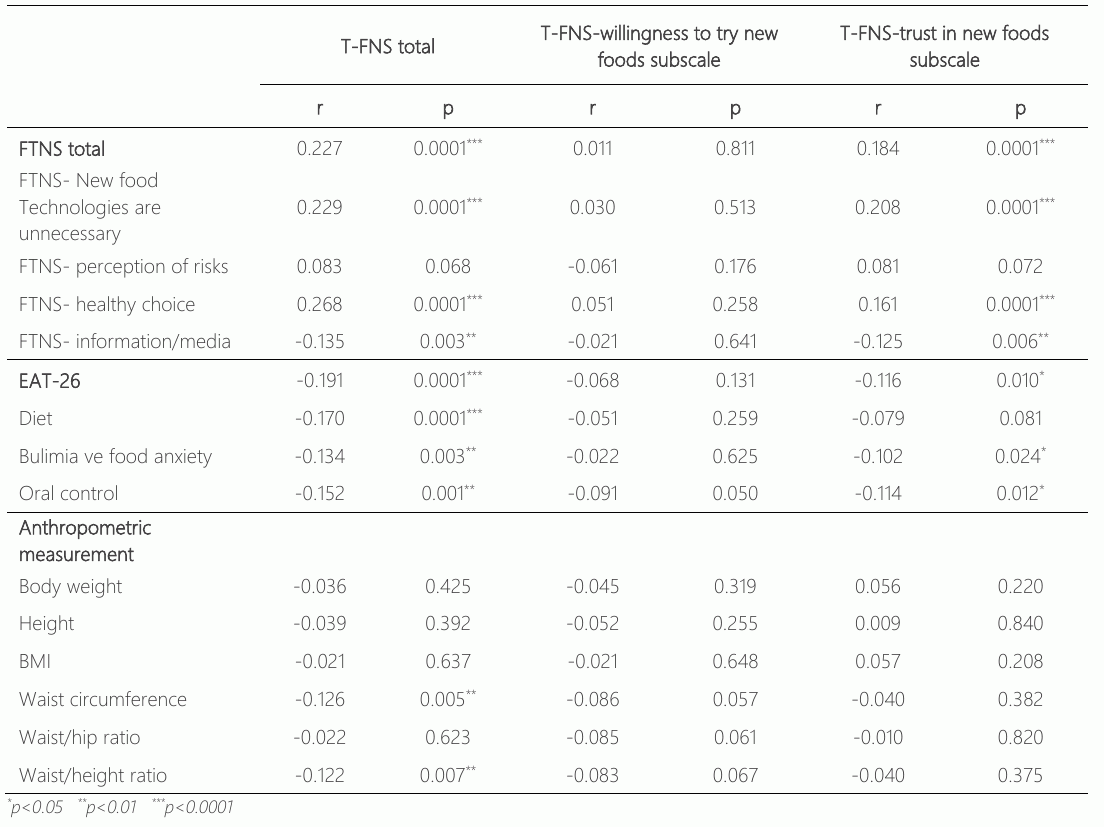
T-FNS total, willingness to try new foods subscale1, and trusting new foods subscale2 score averages were 40.01±10.11, 4.02±1.84, and 3.16±1.45, respectively. FTNS total, FTNS- subscale1, FTNS-subscale2, FTNS-subscale3, and FTNS-subscale4 score averages were 53.62 ±10.11, 24.39±6.40, 16.52±3.21, 8.19±2.96, and 4.52±1.67, respectively. No relationship was found between FTNS total, FTNS-subscale1, FTNS-subscale2, FTNS-subscale3, and FTNS-subscale4 score averages and gender (p>0.05). Table 4 presents all correlations between individuals' food neophobia and subscale scores, other scales, and anthropometric measures. Significant positive correlations were between T-FNS total and FTNS total (r: 0.227, p<0.0001), FTNS-New food Technologies are unnecessary (r: 0.229, p<0.0001), FTNS-healthy choice (r: 0.268, p< 0.0001), and a negative correlation with FTNS-information/media (r:- 0.135, p=0.003). As food neophobia increases, food technology neophobia also increases. Significant positive correlations were found between T-FNS trusting new foods subscale and FTNS total (r: 0.184, p<0.0001), FTNS-New food Technologies are unnecessary subscale (r:0.208, p<0.0001), FTNS-healthy choice subscale (r:0.161, p<0.0001), and a correlation with FTNS-information/media subscale (r:-0.125, p=0.006). No difference was found between the T-FNS-willingness-to-try-new-foods subscale and the FTNS total or subscales (p>0.05). There were negative correlations between T- FNS total and EAT-26 (r: -0.191, p<0.0001), Diet (r: -0.170, p<0.0001), Bulimia and food concern (r: -0.134, p=0.003), and Oral control (r: -0.152, p=0.001) sub-dimensions. As food neophobia increases, eating attitude decreases. Significant negative correlations were found between the T-FNS trusting new foods subscale and EAT-26 (r:-0.116, p=0.010), the Bulimia and food concern (r: -0.102, p=0.024), and Oral control (r:-0.114, p=0.012) sub-dimensions. No difference was found between the T-FNS-willingness to try new foods subscale and EAT- 26 and its sub-dimensions (p>0.05). Negative correlations were between T-FNS total and waist circumference (r: -0.191, p<0.0001) and waist-to-height ratio (r: -0.191, p<0.0001). As food neophobia increases, waist circumference decreases. No difference was found between T-FNS total, T-FNS-willingness to try new foods subscale, and T-FNS-trusting new foods subscale, and body weight, height, BMI, and waist-hip ratio.
Discussion
FNS is widely used in the detection of food neophobia. The fundamental evolutionary mechanism in food neophobia is the rejection of unknown food with the thought that unfamiliar foods are less tasty and that foreign foods will harm their health and cause poisoning. According to a study, high environmental factors such as education level, income level, and socioeconomic status have been associated with decreased food neophobia (25). Since these concepts may overlap, this study aimed to examine the cross-sectional relationship among food neophobia, eating attitude, and the Food Technology Neophobia Scale. Food Technology Neophobia Scale was developed by Cox and Evans in 2008 for individuals aged 18-65.
According to our study, the average score of the food technology neophobia in Turkish respondents was 53.62±10.11, and the average score of food neophobia was 40.01±10.11 (Table 3), while the average score of neophobia In relation to food technology, the mean ± SD for Brazilian respondents was 47 ± 12 (26). In a study, significant relationships were observed between the FNS total score and the FTNS subscale score, and a weak but significant relationship between the FNS and FTNS (24). McKenzie et al. reported a larger correlation between FNS and FTNS (27). In our study, as food neophobia increases, food technology neophobia also increases. Kahriman et al. reported a mean FTNS score of 47.63±12.95, indicating a moderate level in the Turkish sample. Attitudes toward new food technology vary across populations. Studies have reported that attitudes differ with respect to factors such as age, sex, income status, education level, place of residence, food technology neophobia, and environmental attitude. As the approach to new food technologies shapes the food industry and market, defining neophobia in a society is significant (24). Significant relationships were observed in this study between FNS total scores and FTNS subscale scores, as reported by Kahriman et al. Internal consistency was 0.73 for the Portuguese version of the FTNS. In the Chinese version of the scale, the authors reported a Cronbach's alpha of 0.876 across all items. A study exploring the psychometric properties of the scale in South America reported a lower Cronbach's alpha value of 0.621 (12). In our research, the T-FNS scale had a Cronbach's alpha of 0.763. The FTNS Cronbach's alpha was 0.717.
Food neophobia is generally thought to change with age and increase with age. In another study, the increase in food neophobia was found to be associated with increasing age. This fact has also been associated with higher food neophobia levels in older individuals who have not been exposed to different food sources and have not grown up with diversity. In our study, the 18-30 age group had a higher willingness to try new foods than the 31-45 age group. In a study by Baygut, food neophobia was accepted as a behavioral characteristic affecting BMI by being associated with inadequate eating habits and low diet quality (28). In our study, no difference was found between BMI classification and total scale scores and subscale scores. At the same time, no significant difference was found between T- FNS total, T-FNS-willingness to try new foods subscale, and T-FNS-trusting new foods subscale and body weight, height, BMI, and waist-hip ratio. In another study, it was found that neophobic individuals had lower BMI compared to neophilic individuals. The age group in our study was 18-30 years. Therefore, it can be suggested that the neophobia tendency may increase if BMI levels exceed the normal range in advanced age. In studies conducted with adults, food neophobia is associated with lower diet quality and higher BMI (29).
The key finding is that mean Food Neophobia scale scores were significantly lower among those who eat outside the home in our study. A significant difference was found in the mean subscale scores for willingness to try new foods across age groups, appetite status, and eating out of the home. The subscale on trusting new foods was significantly higher among non-smokers than among smokers. Trusting in new foods was found to be considerably higher in alcohol users than in non-users. Willingness to try new foods was significantly higher among individuals with good appetite than among those with poor appetite. It was found that individuals who do not eat outside the home have substantially higher neophobia toward new foods, lower willingness to try them, and greater trust in them than those who eat outside the home (Table 1). In a Brazilian study, FTNS was not influenced by marital status and gender, but it was significantly influenced by age and education level. In our research, FTNS was not influenced by gender, marital status, or education level.
No differences were found in the total mean score of the food neophobia scale, the subscale mean for trusting new foods, or in anthropometric measurements. EAT-26 total and oral control mean scores were found to be statistically significantly higher in women. In our study, Individuals with waist-to-height ratios, waist circumference, and waist-to-hip ratios within the normal range are more willing to try new foods than those within the risky range. Results indicated that neophobia was not related to anthropometric measurements. EAT-26 total (p=0.022) and Oral control (p=0.001) mean scores were found to be statistically significantly higher in women than in men. No significant difference was found between diet, bulimia, and food anxiety sub-dimension mean scores and gender (p>0.05). As food neophobia increases, so does food technology neophobia. While food neophobia increases, eating attitude decreases. In a study evaluating food neophobia and orthorexia nervosa tendencies, it was insufficient to establish a relationship (29) clearly.
No difference was found between the food neophobia scale total score and anthropometric measurements. Our study found no differences in FN levels by gender. Additionally, in another trial, no differences between men and women were reported among individuals from Canada, Portugal, and Sweden (5).
We conducted this study through online platforms. Therefore, all data were based on participants’ statements. Furthermore, we included participants who volunteered for the study and were over 18 years of age. Given the socio-demographic characteristics, our sample comprises individuals with a high level of education. Therefore, studies need to address these problems and be conducted in more specific populations in Türkiye.
Conclusion
Although created almost thirty years ago, the FNS remains the most widely used scale for evaluating individual FN and has been applied across a wide range of studies. It is essential to identify individuals with food neophobia throughout the country. Previous studies have consistently shown that FTNS is an effective tool for measuring neophobia toward foods produced using new technologies across cultures. We believe that measurements using the scale will be beneficial for disseminating the concept of conscious consumption by increasing individuals' relative awareness of their food preferences.
Declarations
- Author contributions (CRediT)
- All authors contributed equally to all 14 CRediT roles (Conceptualization, Data curation, Formal analysis, Funding acquisition, Investigation, Methodology, Project administration, Resources, Software, Supervision, Validation, Visualization, Writing – original draft, Writing – review & editing).
- Funding
-
The authors declare no financial support during the conduct of this research.
- Conflicts of interest
- The author declared that there is no conflict of interest regarding the publication of this paper.
- Ethics approval
- It was conducted in accordance with the principles of the Declaration of Helsinki.
- Data availability
- A data availability statement was not reported in the published version of this article.
References (29)
25 of 29 references are linked to their DOI.
- Zhao JB, Gao ZB, Li YX, Zhang XY, Zou LQ. The food neophobia scale (FNS): Exploration and confirmation of factor structure in a healthy Chinese sample. Food Qual Prefer. 2020;79:103791. DOI Crossref PubMed Google Scholar
- Uçar EM, Gümüş D, Karabulut E, Kızıl M. Yeni Besin Korkusu Ölçeğinin Türkçeye uyarlaması ve uygun faktör yapısının belirlenmesi. Türkiye Klinikleri Sağlık Bilimleri Dergisi. 2021;6(3):393-400. PubMed Google Scholar
- Ceylan V, Akar Şahingöz SA. Yetişkin bireylerde gıda neofobi düzeyinin belirlenmesi. J Tour Gastr Stud. 2019. PubMed Google Scholar
- Baysal I. Spor yapan bireylerin yeni besin korkusu ve ortoreksiya nervoza eğilimleri ile beslenme durumları arasındaki ilişkinin belirlenmesi [Yüksek lisans tezi]. Ankara: Başkent Üniversitesi Sağlık Bilimleri Enstitüsü; 2020. DOI Crossref PubMed Google Scholar
- Rabadán A, Bernabéu R. A systematic review of studies using the Food Neophobia Scale: Conclusions from thirty years of studies. Food Qual Prefer. 2021;93:104241. DOI Crossref PubMed Google Scholar
- Pliner P, Pelchat M, Grabski M. Reduction of neophobia in humans by exposure to novel foods. Appetite. 1993;20(2):111-123. DOI Crossref PubMed Google Scholar
- Cox DN, Evans G. Construction and validation of a psychometric scale to measure consumers’ fears of novel food technologies: The Food Technology Neophobia Scale. Food Qual Prefer. 2008;19(8):704-710. DOI Crossref PubMed Google Scholar
- Bernal-Gil NY, Favila-Cisneros HJ, Zaragoza-Alonso J, Cuffia F, Rojas-Rivas E. Using projective techniques and Food Neophobia Scale to explore the perception of traditional ethnic foods in Central Mexico: A preliminary study on the beverage Sende. J Sens Stud. 2020;35(6):e12606. DOI Crossref PubMed Google Scholar
- Basaran AG, Ozbek YD. A study of the relationship between university students’ food neophobia and their tendencies towards orthorexia nervosa. Behav Sci (Basel). 2023;13(12):958. DOI Crossref PubMed Google Scholar
- Proserpio C, Laureati M, Invitti C, Pagliarini E. Reduced taste responsiveness and increased food neophobia characterize obese adults. Food Qual Prefer. 2018;63:73-79. DOI Crossref PubMed Google Scholar
- Costa A, Silva C, Oliveira A. Food neophobia and its association with food preferences and dietary intake of adults. Nutr Diet. 2020;77(5):542-549. DOI Crossref PubMed Google Scholar
- Ergin SÖ, Güzel A. The Food Technology Neophobia Scale: A validity and reliability study in Turkish. Gümüşhane Üniversitesi Sağlık Bilimleri Dergisi. 2024;13(1):8-18. PubMed Google Scholar
- Olabi A, Najm NEO, Baghdadi OK, Morton JM. Food neophobia levels of Lebanese and American college students. Food Qual Prefer. 2009;20(5):353-362. DOI Crossref PubMed Google Scholar
- Aiello P, Peluso I, Villaño Valencia D. Alcohol consumption by Italian and Spanish university students in relation to adherence to the Mediterranean diet and to food neophobia: A pilot study. Healthcare (Basel). 2022;10(2):393. DOI Crossref PubMed Google Scholar
- Proserpio C, Almli VL, Sandvik P, Sandell M, Methven L, Wallner M, et al. Cross-national differences in child food neophobia: A comparison of five European countries. Food Qual Prefer. 2020;81:103861. DOI Crossref PubMed Google Scholar
- Hursti UKK, Sjödén PO. Food and general neophobia and their relationship with self-reported food choice: familial resemblance in Swedish families with children of ages 7–17 years. Appetite. 1997;29(1):89-103. Food neophobia and food technology neophobia Gulcan Arusoglu DOI Crossref PubMed Google Scholar
- Pliner P, Hobden K. Development of a scale to measure the trait of food neophobia in humans. Appetite. 1992;19(2):105-120. DOI Crossref PubMed Google Scholar
- Evans G, Kermarrec C, Sable T, Cox DN. Reliability and predictive validity of the Food Technology Neophobia Scale. Appetite. 2010;54(2):390-393. DOI Crossref PubMed Google Scholar
- Faul F, Erdfelder E, Buchner A, Lang AG. Statistical power analyses using G*Power 3.1: Tests for correlation and regression analyses. Behav Res Methods. 2009;41(4):1149-1160. DOI Crossref PubMed Google Scholar
- Faul F, Erdfelder E, Lang AG, Buchner A. G*Power 3: A flexible statistical power analysis program for the social, behavioral, and biomedical sciences. Behav Res Methods. 2007;39(2):175-191. DOI Crossref PubMed Google Scholar
- Duman E, Akçil Ok M, Keser A. Besin neofobisi ölçeğinin Türkçeye uyarlanması: geçerlik ve güvenirlik çalışması. Kocaeli Üniversitesi Sağlık Bilimleri Dergisi. 2020;6(2):157-161. PubMed Google Scholar
- Garner DM, Garfinkel PE. The Eating Attitudes Test: An index of the symptoms of anorexia nervosa. Psychol Med. 1979;9(2):273-279. DOI Crossref PubMed Google Scholar
- Ergüney-Okumuş FE, Sertel-Berk HÖ. Yeme Tutum Testi kısa formunun (YTT-26) üniversite örnekleminde Türkçeye uyarlanması ve psikometrik özelliklerinin değerlendirilmesi. Psikoloji Çalışmaları. 2019;40(1):57-78. DOI Crossref PubMed Google Scholar
- Kahriman M, Baş M. Reliability and validity of the Food Technology Neophobia Scale in a Turkish sample. Int J Food Sci Technol. 2024;59(4):2603-2611. DOI Crossref PubMed Google Scholar
- Bolat H, Ergün C. Yeni besin deneme korkusu: Obezite gelişiminin hem nedeni hem sonucudur. Adnan Menderes Üniversitesi Sağlık Bilimleri Fakültesi Dergisi. 2023;7(1):145-158. DOI Crossref PubMed Google Scholar
- Vidigal MC, Minim VP, Simiqueli AA, Souza PH, Balbino DF, Minim LA. Food technology neophobia and consumer attitudes toward foods produced by new and conventional technologies: A case study in Brazil. LWT - Food Sci Technol. 2015;60(2):832-840. DOI Crossref PubMed Google Scholar
- McKenzie K, Metcalf DA, Saliba A. Validation of the Food Technology Neophobia Scale in a Chinese sample using exploratory and confirmatory factor analysis. Food Qual Prefer. 2021;89:104148. DOI Crossref PubMed Google Scholar
- Baygut H. Food neophobia in the elderly: Evaluation of constipation, malnutrition and nutrition. J Health Sci Med. 2025;8(1):10-17. DOI Crossref PubMed Google Scholar
- Baysal I, Kızıltan G. Spor yapan bireylerin yeni besin korkusu ve ortoreksiya nervoza eğilimleri ile beslenme durumları arasındaki ilişkinin belirlenmesi. Beslenme ve Diyet Dergisi. 2020;48(3):48-55. DOI Crossref PubMed Google Scholar
Respond to this article
Comments on a published article are welcome as a Letter to the Editor.
Get an e-mail when new articles in your fields are published
Questions to the authors
Questions are moderated: an editor approves each question, the authors answer, and an editor approves the answer before both appear here.
No answered questions yet.
Ask the authors a question
Discussion
Comments are moderated: they appear after the writer confirms the e-mail address and an editor approves them. Each comment carries a conflict-of-interest statement.
No comments yet.
Write a comment
Tell me when this article is cited
Leave your e-mail address and confirm it. These notices are not being sent yet; your confirmed address is kept for them and used for nothing else.
Read the full text
Open the PDF here
Loading the PDF…
If the PDF does not show here, use the download button above.
How to cite this article
Arusoglu G. The Relationship Between Food Neophobia, Food Technology Neophobia and Anthropometric Measures in Adults: A Web-Based Study. Ulutas Med J. 2025;11(4):62-73. doi:10.5455/umj.20250910083919
Arusoglu, G. (2025). The Relationship Between Food Neophobia, Food Technology Neophobia and Anthropometric Measures in Adults: A Web-Based Study. The Ulutas Medical Journal, 11(4), 62–73. https://doi.org/10.5455/umj.20250910083919
Arusoglu, G. (2025) 'The Relationship Between Food Neophobia, Food Technology Neophobia and Anthropometric Measures in Adults: A Web-Based Study', The Ulutas Medical Journal, 11(4), pp. 62–73. doi: 10.5455/umj.20250910083919.
@article{umj282921,
  title = {The Relationship Between Food Neophobia, Food Technology Neophobia and Anthropometric Measures in Adults: A Web-Based Study},
  author = {Arusoglu, Gulcan},
  journal = {The Ulutas Medical Journal},
  year = {2025},
  volume = {11},
  number = {4},
  pages = {62--73},
  doi = {10.5455/umj.20250910083919},
  url = {https://www.ulutasmedicaljournal.com/?mno=282921},
  issn = {2149-388X}
}