Mapping normal blood flow to the fetus, week by week
Doppler scans of 163 healthy pregnancies chart how vessel indices change from mid- to late pregnancy.
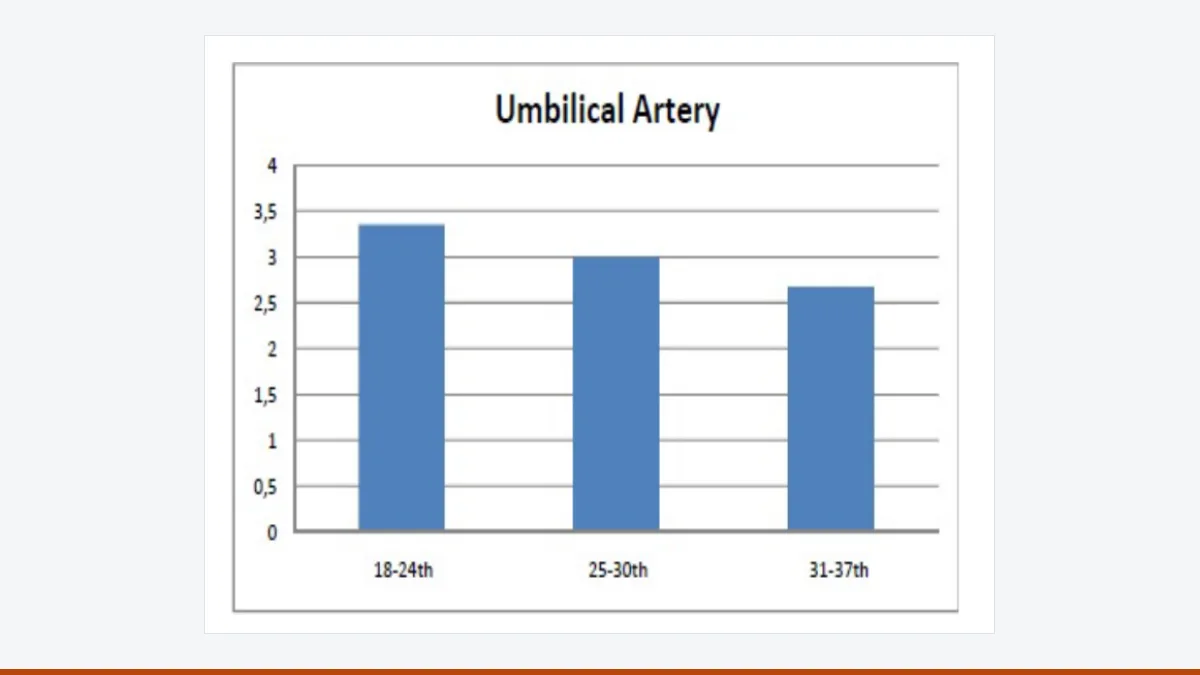
To spot a struggling fetus, doctors first need to know what normal blood flow looks like at each stage of pregnancy.
In The Ulutas Medical Journal, radiologists scanned 163 women with uncomplicated pregnancies once each, between weeks 18 and 37, using the same machine and a single examiner. They measured arteries of the cord, uterus and fetal brain, plus several veins.
Resistance in the arteries fell as pregnancy advanced. In the umbilical artery, the systolic-to-diastolic ratio dropped from 3.35 in the earliest group to 2.67 in the latest; a similar decline appeared in the fetal brain artery. Flow speed in the umbilical vein stayed broadly stable.
The authors urge sonographers to look at veins as well as arteries, since together they may flag growth restriction or oxygen shortage earlier.
Caveat: each woman was scanned only once, so the curves compare different groups rather than tracking the same pregnancies over time.
Source: Mehmet Sarica et al. Color Doppler Ultrasonographic Evaluation of the Intrauterine Hepatic and Portal Venous System. Ulutas Med J 2023. doi:10.5455/umj.20230901100512.
Image: Figure 1 of the article, CC BY-NC 4.0.